With a vote on the expansion of Heathrow Airport in the House of Commons looming today, a new report from Fellow Travellers (and co-authored by myself), Runway For The Few, has been published which casts a critical eye over the justifications used by the government and Heathrow Airport in support of construction of a third runway.

In Runway For The Few we have taken a deep dive into data published by the UK Civil Aviation Authority and Department for Transport to pull together a comprehensive picture of passenger trends at Heathrow and the three other major London airports (Gatwick, Stansted and Luton) since 2000. This data paints a picture which is perhaps surprising to many who have heard the arguments cited in support of Heathrow expansion.

Heathrow makes a lot of noise about its role in supporting UK businesses and expanding trade to emerging markets, but the passenger numbers tell a very different story. Both UK and foreign business passengers flying to or from the UK have been in decline since 2000 as during this period communications technologies have emerged that massively reduce the need to fly staff around the world to conduct business:

Heathrow also trumpets its role in the domestic air travel market but domestic passengers are down more than 50% since 2000:

With the Climate Change Act mandating big reductions in UK emissions and very convenient alternatives to flying available, in a sane world this is exactly the sort of trend that the government would be using to demonstrate their pro-environmental credentials to the world. Instead the government has taken the extraordinary decision of announcing that they will adopt a protectionist approach and reserve slots for regional airports at an expanded Heathrow, rather than letting the market decide.

With business and domestic passenger numbers in decline that just leaves the international leisure market, and this is where all of the growth is happening. International transfer passengers (those stopping at Heathrow and then flying on to other destinations, thus not providing any economic benefit to the UK) have seen big growth since 2000, with international transfer passengers growing over 60%:

Both UK and foreign passenger numbers flying into or out of the UK have been growing rapidly (from 25 million in total in 2000 to over 35 million in 2017) and this growth appears to be accelerating in recent years:

And who are these passengers? Around half of the UK population doesn’t fly in any given year. If you are in the poorest 20% of the population then only 30% fly. Flying is heavily dominated by the most affluent in the UK flying multiple times per year, as this very revealing chart, which was produced using data from the Department for Transport’s National Travel Survey, clearly demonstrates:

As Richard Black observed in New Scientist in 2016, the aviation industry appears to be protected by a Somebody-Else’s-Problem field from The Hitchhiker’s Guide To The Galaxy. The description is apt: an SEP field is a cloaking device which “utilises a person’s natural tendency to ignore things they don’t easily accept”, rendering the object invisible.

An enormous, collective blind spot has built up around aviation (which is already possibly the most protected and cossetted industry on the planet), leading to a widespread belief that it must expand. This expansion is going to primarily benefit a small and wealthy section of society while imposing enormous, externalised environmental impacts on everyone.

There appears to be a lot of wishful thinking going on that some technology will appear and fix the aviation emission problem so that we can carry on flying more and more, but there is precious little evidence that this is going to happen.

Please take the time to read the report. It contains lots of other ineresting data on passenger numbers and frequent flying. Also if you have any questions about the report or the data that underpins it, feel free to post a comment below.

0 comments
4_low-res

In October, ordinary Londoners from all walks of life and from the north, south, east and west of the city got together to help put a stop to unnecessary vehicle engine idling in a series of action events across the capital.

London has some of the worst air quality in the UK. In fact, in early 2016, parts of the capital had already exceeded the EU’s yearly pollution limits in just eight days! Annually, around 10,000 ‘early deaths’ have been attributed to the filthy air we Londoners breathe in every day. The most common pollutants related to transport pollution, NO2 and Particulate Matter (PM), also contribute to a range of health issues including respiratory illnesses, lung and kidney problems and it is estimated that between 15-30% of new cases of child asthma are attributable to poor air quality.

To be fair, there are many government and city level initiatives already underway to clean up the capital’s air, but the citizens of London were also crying out for an opportunity to help with some practical action of their own to help fight air pollution. Now they can!

The week of 17 October saw the official launch of the Mayor of London supported ‘Vehicle Idling Action’ campaign that brought together 12 borough councils from the length and breadth of Greater London in unified action. Each council recruited and trained local residents and staff of businesses to enable them to become a volunteer army of ‘clean air champions’ for their area, talking to pedestrians and motorists alike, raising awareness of the problems of engine idling and gaining pledges from motorists to ‘always switch off when stationary’.

The action events took place in a variety of venues, from schools, to shopping malls, from City Hall to community squares and everything in-between. The volunteers talked to hundreds of passers-by, motorists, taxi drivers, bus drivers and the fabled ‘white van man’ to inform them of the polluting nature of idling their engines when parked up.

The approach of this project is unusual in that it used a game and a positive, engaging approach to get the messages across. Eco action games, a start up social business, created a bespoke version of their popular snakes + ladders game in both a giant size to attract passers-by to the event, and also in a mini version that was given to motorists and children to help spread the messages about air pollution and what we can all do to reduce our exposure. The mini game proved a very popular give-away and hundreds were given away across the week.

The reactions were overwhelmingly positive and, over the week, the cumulative ‘score on the door’ from all events saw around 400 people talked to (both motorists and non motorists), over 200 pledging never to idling again and we found that around three quarters of the idling drivers we talked to switched off there and then when asked.

These events will be happening regularly, across the boroughs for the next 6 months. More information about the project can be found here: idlingaction.london

Green Gumption, alongside its sister company eco action games, and with partners Project Dirt and Cool World Consulting are managing the project on behalf of the Mayor of London’s office and 12 London boroughs.

21_low-res
0 comments

From the 30th November to 11th December 2015, the eyes of the world will be back on Paris, but thankfully for  much more positive, inspiring reasons than the weeks just past.

The 21st Conference of the Parties (COP21 for short) will gather together Heads of State from at least 190 countries around the world. COP21 will argue and debate issues that are essential to the health and survival of our planet – the stakes could not be higher. A consensus on action to reduce our greenhouse gas emissions to a level that will result in the rise in global average temperatures NOT exceeding 2 degrees this century is vital!

Although arguably the most important meeting in a generation, on the planet, for the planet, it is not clear that the message has got through to all. It seems as if wider society does not have a clear understanding of what COP21 is all about, except for the vague idea that “its something to do with stopping climate change”.

Well,  we, together with our sister organisation ‘eco action games’, are partnering with a set of well-known environmental partners to change all that with our quirky, upbeat, actions focused ’12 days of COPmas’ communication campaign.

We are launching a new ‘day of COPmas’ for each day of negotiations at COP21. Each day will feature a theme that is of significant importance to COP negotiations. eco action games, alongside the partner of the day, explain why the issue is of significance to COP21, and, because we are eco ACTION games, we then go on to suggest simple ways that: Citizens, Civil Society and Corporations can play their part.

We end with a longer thought piece on the topic, for readers who are interested in getting a deeper understanding of the issues.

We have started our teaser campaign this week, with our COPmas tree that holds all the clues to which theme we are tackling on each day – see if you can guess what they are?

So do join in the fun & games. We are offering a daily prize of an eco action games compendium set for people who Follow, Like, Tweet or Retweet us. The hashtag we are using is #12COP21.

You can find the full online campaign here

12Cop21 illustration 1resilient planet_COPmas2


0 comments

Listen to me talking to Winifred Robinson on Radio 4’s You & Yours about this issue, here.

Curiously, ever since I blogged about my confusion regarding my electricity usage meter running backwards following a solar PV installation, I’ve received 1000s ‘search term’ hits to my website on this very subject.  It seems like there is quite a lot of confusion out there – not just me then!

To be clear, backward running meters only occur if you have an older, analogue style meter, like the one shown below, coupled with a PV system.  In this case, every KwH of generated solar PV will be registered, consumed locally or not,  through the electricity usage meter literally running backwards. If you generate more than you use (a possibility in summer months), over an extended period you could find yourself with a meter reading that is lower than your last meter reading. This is clearly not what is supposed to happen.  Your usage meter should only register the amount of local generated power you use by not turning at all if your generated power meets your needs, and turning more slowly if it partially meets your need and hence your demand on the grid is lowered.

So far I have only come across one other person with an analogue meter plus PV, but she too had no idea that there was anything wrong, and certainly was not told by her PV installer (a different company to mine) that this would need to be changed.  She has just celebrated her first anniversary of PV ownership, and hence a year of very low electricity bills too!

I find it quite astonishing, and not a little remiss, that the installers are not making this situation clear to customers. Is it not part of the basic PV installer training to warn people that this will be the case with analogue style meters, and that they will need to inform their energy company that they will require an upgrade?

I’m also not clear where liability lies in this situation?  When you register your PV system with your FiT payment supplier (which does not need to be your energy suppler BTW) you do state what meter you have, but in my experience, and that of the other analogue meter/PV owner, nothing comes of this.  There does not seem to be a recognition within the FiT payment suppller that this is an issue.  Which is curious given that they will potentially be losing out on revenue if they supply your power too.

So, take the situation of a PV owner running an analogue meter for years before their energy supplier twigs. Will the householder be liable for paying back the actual amount of electricity they have used from the grid but not paid for?  Apart from the issues surrounding the estimating of exactly how much is owed, on which side is the onus to ensure the meter is changed to a digital ‘backstop’ electricity meter promptly?

If the householder is not informed that it is a problem at the commissioning stage, and doesn’t really understand what is happening (I only realised there might be an issue because through the summer I was generating more than I was using, so had a negative meter reading situation) is it their responsibility, are they legally liable?  Or is it the responsibility of the FiT payment suppler to check the meter type? But if the FiT payment supplier is not the energy supplier, then there is no incentive there either?

152 comments

It’s the new year and I bring tidings of good cheer for owners of old, cold, solid walled homes across the land! It would seem that government departments have finally seen sense, banged a few heads together and have changed the planning guidance for people wanting to add external cladding to their walls.

I brought the issue up just over a year ago when I first came up against this ridiculous planning restriction as I was investigating external cladding for my own gable wall. The orginal post is here:

Desperately seeking soild wall insulation in Lambeth

Nearly a year later, and much hassling of governent officials, and nothing had changed:

My quest for solid wall insulation – the battle continues

In that year I had brought the subject up where ever I found myself in a position to do so. Even haranguing Greg Barker about it at the eco tech conference in Brighton over the summer, at the time he seemed rather clueless about the whole issue to be honest.

An article in the Sunday Telegraph about my situation brought another flurry of interest and lots of emails for people who were in the same position. Read it here

Well, I’m pleased to annouce it seems as if all that effort has paid off at last! On the 11th January, DCLG – the Department reponsible for buildings and planning laws published revised guidance for external solid wall insulation. Making it, to all intents and purposes ‘permitted development’ and hence not requiring planning permission in most normal circumstances (listed buidlings and conservation areas aside). Hoorah!

Here’s the link to the new technical guidance: Permitted development fo householders

Well, of course I can’t claim the credit for this, but I do hope my small contribution to getting the problem out there and heard by various local and central government officals went some way to making this breakthrough happen.

Now I can work with the great people at Sto and get this insulation up on my side wall hopefully before the winter is over, and reap the benefits of a warmer cosier home.

Watch this space for updates on how I get on.

5 comments

inductionhobMy blog post of the 11th November, where I talked about the apparently huge standby consumption of my “efficient” induction hob (click here to read it), has generated much discussion and debate about the relative merits of this type of electric cooking.

Since I published the post I have been in discussion with some technical expert colleagues of mine who work in a testing house that deals with measuring appliances on a daily basis so are pretty well informed on such matters.  They have been telling me all about the rather complex issue of the ‘power factor’.  Now, I have to admit that it has taken me a while to get my head around the concept, but I think I finally get it and ghence this is my semi non-technical understanding of the issue taken from resident techie expert Steve’s explanation (Steve’s explanation is copied in full at the bottom of this post for the more technically able amongst you):

Power factors are a result of the difference between ‘true power’ which is the actual, real power (measured in Watts) consumed by an appliance and the ‘apparent power’ (the product of Voltage multiplied by Current (Amp), and represented by VA) that appears to be consumed.  With most household level appliances these two types of power: ‘true’ and ‘apparent’ are identical, BUT with certain products this is not the case and the ‘apparent power’ can appear much higher than the actual power that is being consumed – still with me?

The reason for the existence of ‘apparent power’ is the power factor.  The power factor exists when there is a phase shift between the Voltage and Current waveforms, and this phase shift can happen when the appliance being powered has inductive or capacitive properties – ie such as an induction hob, and, apparently, low energy light bulbs such as CFLs.

The typical type of domestic ‘Real Time Display’ unit which displays overall electricity consumption in your home, such as my Wattson or others on the market, are of a type that cannot cope with the differentiation of true versus apparent power, and so, when measuring the consumption of, say, my induction hob, is actually displaying the ‘Apparent power’ rather than actually what my hob is consuming.  Still with me?

The main implication of such a ‘power factor’ does not lie with the householder or their electricity bill, as they only pay for the true power they consume, but the power station has to work harder than normal to deal with this issue – so for the supply side and grid, such ‘power factors’ are an issue as they require a bigger drain on the energy production side.

To test out if this was actually the case with my induction hob, and because you cannot measure a hob’s consumption on a single device electricity meter as it is wired in to the mains, I carried out an experiment overnight.  I turned everything powered in the house off at the plug, so my electricity consumption reading on Wattson was zero, and then turned my hob back on.  The Wattson told me I was consuming 150 Watts or thereabouts. I took a meter reading, went to bed and ten hours later took another reading.

The actual consumption of my induction hob over that ten hour time period was 260 Wh, so an average standby consumption of ~25 Watts.  That is a big difference to the 150 Watts my Wattson was recording; a difference of six times larger in fact!  I downloaded the recorded data from my Wattson for that time period and sure enough, it had recorded apparent consumption of 1560 Wh over the ten hour period.

So, what does that tell me?  Well, my induction hob is not as bad as I thought for starters which is a good thing, as I do love cooking with it.  A standby consumption of 25 Watts is not great by any means, but isn’t anywhere as bad as 150 Watts.  So its costing me around £30/year to do nothing, that is about 12% of my total annual consumption, rather than costing me about £180 and being over 50% of my total.

What is does mean though, is I cannot trust my Wattson to give me any sort of accurate reading on my total electricity use. As a result of this power factor issue (I also have a load of CFLs, so it is probably overestimating their consumption too)  I cannot, with any confidence, work out how much of my PV generated power I am actually using as I haven’t an accurate way of measuring total consumption, which is annoying.


29 comments

Update January 2014: Before you read on, I need to make it clear that my induction hob DOES NOT actually use the amount of standby electricity that it appears to in this article.  I eventually tracked the problem down to an issue with the electricity Real Time Display meter (RTD), otherwise known as electrcity monitors, I was using to monitor my electrcity consumption.  Electricity real-time display meters do not cope well with appliances that have an inductive load – such as an induction hob, and consequently display the wrong, higher, power consumption as a result.  This is explained in detail in the update blog post I wrote subsequently and provide a link to at end of this article. I write this update as this blog post has been read over 35,000 times in a year and many readers are not reading the update to the story – hence are thinking induction hobs are really bad.  THEY ARE NOT!  So please, if you read this article, be sure to read the next in the series, that explains what is actually going on.

I do not want to remove this article as many people are finding this article because they have discovered the same ‘problem’ when using electricity meters to monitor consumption, hence I want to leave the story as it unfolded for me, so others can understand the ‘problem’, which is actually with the power monitor  not being able to cope with inductive loads, not the hob.

November 2012

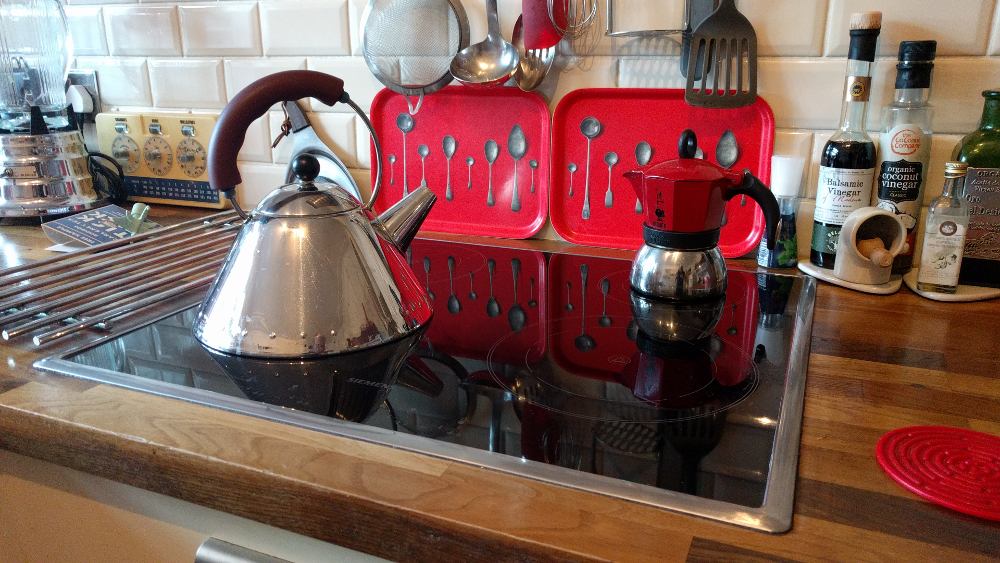
I moved into my home some years ago and immediately set about refurbing the kitchen which was in a shocking state.  One kitchen appliance I had been coveting for a long while was an electric induction hob.  In my opinion it was a much more practical appliance than its gas fueled equivalent, with all its different bits that are tricky to keep clean and that persistent, nagging worry of whether you left the gas on or not.  More importantly, the induction hob is promoted as a very efficient way to cook, being around 30% more efficient than other types of electric hob.  At the time they were still a niche product, and relatively expensive to purchase compared to gas and other electric hobs, but I saw it as an investment.

So I went ahead and bought one from a very well respected, German manufacturer of kitchen appliances, and it was love at first use.  The induction hob is an absolute joy to cook with.  It is instantly responsive, it has a easy wipe-clean glass surface, you cannot accidently leave it on and there are no twiddly knobs or buttons, just a simple, minimalist, touch sensitive control panel embedded into the glass itself.  Although expensive I didn’t regret my purchase for a moment, and I was sure in the knowledge that I had also made an energy efficient purchase (at the time I was thinking ahead to when I would install PV, so my hob cooking would be both cost and carbon free eventually).

Later on, I was testing out a range of ‘Real Time Display’ (RTD) products for work, these are devices you attach to your electricity meter that give you minute by minute information on your electricity usage.  I then did exactly what people typically do when first installing an RTD, I went around the house, turning one gadget off after another, to see exactly how much power my individual appliances and gadgets were consuming.

It soon became apparent that there was something using rather a large amount of background power, and I couldn’t easily track it down!  Everything with a plug attached was switched off, including the fridge-freezer, and still there was about a 70-80 Watt (W) residual consumption.  Eventually I twigged – the only thing I hadn’t switched off at the mains was the induction hob.  Luckily the red isolation switch for the hob is easily accessible, and as soon as I turned it off, my RTD showed almost zero.

Imagine my shock?!  My wonderful, seemingly energy efficient induction hob was burning through a huge amount of power when it was, ostensibly, doing absolutely nothing! I was horrified, and checked, then double checked, my findings with a range of RTDs at my disposal. They all displayed the same bad news – my beloved hob was hugely wasteful in ‘standby’ mode.

At an average consumption of 75 W, and, by my calculation, taking off an average of one hour’s worth of actual usage a day which is a tad generous, in standby for 23 hours per day, I calculated my hob was using 1.8 kWh/day.  This was costing me, at an average electricity unit price of 14.5pence, nearly £100 a year to run, when it wasn’t doing anything useful!

The other finding was, as my entire annual electricity use was only approximately 1800 kWh/year (as calculated through my electricity bill), that my hob, whilst ‘idling’, was responsible for one third of my entire electricity consumption.

My “cunning” solution to this problem was to keep switching the hob off at the isolation switch, both overnight and we left the house each day.  This worked well for about a fortnight,  but after that  my hob suddenly stopped working!  There was nothing for it but to call out an engineer and luckily my hob was still under guarantee.  An engineer duly turned up and expressed surprise that such a new, typically reliable appliance should suddenly go ‘kaput’ just like that.  I acted as innocently as I could and did not reveal I was switching it off each day as I guessed that might have invalidated the warrantee.  He fixed it, and I decided that it wasn’t too wise to continue switching it off daily especially as I was coming to the end of my warrantee period, so I just decided to swallow the extraordinarily high running cost.

Roll forward to the present day.  Since installing PV panels over a year ago I have been monitoring both my electricity use and production carefully through the use of my PV enabled Wattson RTD meter, which gives me graphical breakdowns of total usage by minute, hour, day and month.  What I have noticed over the last twelve months is a gradual increase in my typical daily usage of electricity; even though we have not added any new appliances to the mix and are as careful as ever with our usage.  So, for example, instead of the typical 1800 kWh/year total consumption, I am now looking at around an estimated 2200 kWh/year over the past 12 months according to my Wattson real time display meter.

My first thought was that our 6 year old fridge-freezer was deteriorating in performance, so I checked that – no joy there.  I also checked our base load consumption (with hob switched off) when we were away on holiday for a week, that turned out to be a reasonable 1.6 kWh/day.  Then we went through the house, turning off one product at a time to see if we could identify the culprit – still no luck!  Until, yes you guessed it, we arrived to the hob.  Now, I was used to the hob’s 70-80W consumption pattern, so was expecting to see that level of reduction but, imagine my shock yet again when the RTD meter dropped by around 150W when we switched it off?!  We tested this thoroughly, and when we next went away we left the hob on, to check background consumption.  Sure enough, background usage as monitored by the RTD, over a 24 hour period with no-one at home, but with the hob left on, was around a total electrcity use of 5.5 kWh.  This means it is now using around 1200 kWh/year whilst idling, inexplicably the appliance seems to have suddenly deteriorated in performance?

Scaled up over a year, and with a new annual total electricity usage pattern of 2200 kWh, it appears to mean my hob is now responsible for over half my entire electricity consumption and is costing me £150 a year whilst doing absolutely nothing except waiting for me to come and turn it on through the touch sensitive control panel.

At that extraordinaily high running cost, I thought I’d look online to see if it would be worth my while buying a new, truly efficient model, but the problem is, as far as I can ascertain, no manufacturer currently displays the ‘standby’ function energy consumption in their publicly available product details for hobs.  Electric hobs will be soon coming under the EU energy label jurisdiction, and that does have a requirement for any ‘standby’ mode not to have a higher consumption load than 0.5W. My worry is if the mode that my hob sits in whilst waiting to be turned on at the touch control is defined and labelled something other than ‘standby’ mode, for example ‘quick start’ mode or something similar, then manufacturers can legally by-pass the standby requirement and continue to produce such inefficient appliances.

Please follow this link for an update on this issue.  The effect I was seeing on my electricity display meter  (RTD) is not actually real, and the electricity usage of my hob in standby mode is actually MUCH LESS than what I describe here due to a phenomenon known as the ‘power factor’.


35 comments

I have now collected a year’s worth of data on how my modest, 1.68kW peak PV system has performed over the last twelve months, and it makes for interesting reading.

Over the period October 2011 through to the end of September 2012, I generated a total of 1075 kWhs.  Across that same period I consumed a total of 2218 kWhs of electricity (a large jump upwards from years gone by and I’m at a bit of a loss to explain where that increase has occurred – but that’s for another blog post).  So in total I have generated a little less than half my yearly demand.

My new backstop meter, installed at the end of September 2011, informs me that my total net electricity demand over the last 12 months, that is from the grid, totaled 1430 kWhs.

Hence that in turn that tells me that my PV system has fulfilled approx 35% of my total electricity use over that time period; not bad for a small system!

Even more encouragingly, it also shows that I have managed to locally utilise around 75% of my total PV generating capacity.  Only 26.5% was exported out to the grid.  We have been changing our habits and behaviours to maximise usage and also, as I work from home for a significant proportion of the day, I am able to take advantage of sunny afternoons to put the washing on, and to cook meals, but regardless I’m particularly proud of this statistic.

When we come to payback times, the data isn’t so encouraging.  An approximate 1000 kWh annual output has garnered me around £450 in FiT payments this year, including the extra 3pence for 50% of the generating capacity that is assumed is put back into the grid (for me that is generous as I’m only putting back 25%!).

The 788 kWh of free PV electricity I have used has saved me around £100 in annual electricity charges.

Put together that adds up to a total of £550 savings per annum.  On a £8000 original outlay, it will take around 15 years to pay back the original capital cost.  Far greater than the sub 10 year claims that abound in the industry.  This doesn’t overly concern me, as there is another 10 years of useful service out of the system after all original costs are paid off, and the point of having the system wasn’t just to get a quick payback.  But it is an interesting finding, and I would very interested in hearing from other PV owners to see if I am typical or whether my smaller than average system, and the fact I do not have a perfectly due south aspect has reduced my generating capacity to a significant extent?

So, please get in touch if you have an interesting PV generation story to tell.  is your system over- or under- performing? and if so, why do you think that is?

Other related blogposts on PV generation and ownership by paula owen consulting:

Being a PV generator: Lessons I have learnt Part 1

Being a PV generator: Lesson learnt Part 2

PV systems and meters running backwards: need for clear guidance


10 comments

Well, tomorrow heralds a historic day in the long, century-old history of the traditional, incandescent light bulb.  As of the 1st September 2012, the last stage of the EU-wide gradual incandescent bulb phaseout will begin.

This all started back in the late 2000s, with the EU announcing its intention to remove these inefficient products from the shelves of Europe.  For once the UK was ahead of the game, grandly pronouncing it would be launching a voluntary phaseout of the high wattage bulbs a whole twelve months before the official ban came into play.

The first to disappear off our shelves was the 100Watt (and above) bulb, the official timeline started in 2009; then came the 60Watt and above a year later and now the 40Watt and above has been banned.

So, what does this mean in practice?  It does not mean that all 40Watt bulbs will be cleared off the shelves come the 1st September.  Retailers are allowed to continue selling their existing stock until they run out.  But they will not be able to buy new stock of any incandescent bulb 40Watt or higher.  To all intents and purposes the reign of the traditional light bulb is over!

I’ve been, largely unintentionally, pretty close to this piece of legislation over the years.  As a main spokesperson for EST I was regularly wheeled out to talk to the press about the various stages of the ban and to try to influence opinion on the virtues of the new efficient range of bulbs.  I even ventured into the ‘lair of the dragon’, the dread Daily Mail offices (a very grand old Art Deco building in off High St Ken), to try to convince the journos there that compact fluorescent light bulbs were not, in fact, the spawn of the devil and that the new generation of them worked very well.  I’m not sure I succeeded in that one I’m sorry to say!

And just today I was interviewed on the radio again, to explain this last piece of the EU lighting efficiency jigsaw.  And still, like a broken record, I was again defending the quality of energy efficient light bulbs.  It’s so depressing that there continues the mis-conception that they take forever to warm up, the colour is drab and cold; they are big, stick-like and ugly – it’s simply not true.

OK, some facts, to hopefully help dissolve this misplaced nostalgia for old fashioned incandescent light bulbs.

Do you know of any other product out there that would still be for sale in the marketplace if it was only 10% efficient at doing the job it was made for? It seems hardly credible when you think of it that way. But it’s a fact that the incandescent bulb, for all of its 100+ year lifetime, has only been around 10% efficient at converting the electricity it consumes into light!  The other 90% is wasted as heat!

Ah, I hear the ‘disgruntled of Tonbridge Wells’ claim – but that heat is useful, it helps heat up your home!  Without it you need to heat your house more!  Well, consider the facts, in the main light bulbs are positioned close to the ceiling, and heat rises.  You mostly want heat at ground level, where you are!  Also, electricity is three times as expensive as gas per unit, so if you have a gas central heating system, even if the boiler is old and only 60-70% efficient, surely you will want to be heating your home with gas rather than with electricity?

Ah they cry, but they take forever to warm up.  Not any more, there modern varieties have a very quick warm up phase, a matter of seconds.  And anyway I have always thought the gentle warm up of the CFL was a bonus.  Before I converted to CFLs, and had to turn a light on in the middle of the night, I would be incapacitated for a minute or so as the sharp, viciously bright light of the incandescent bore into my eyelids, so much so that I laid blinded and immobilised until my eyes had gotten accustomed to the harshness. The gentle warm up of the CFL cuts out that effect completely and so is a time saver in my eyes (if you’ll excuse the pun).

The lack of shapes and sizes argument doesn’t wash any more either.  They come in every size and type feasible nowadays.  You can get dimmables, you can get ‘looky likeys’ that have the familiar bulb type shape, you can get various colour tones.  The emergence of LED varieties in recent years has increased the variety available even more -albeit at a premium cost at present, but since the LED varieties last up to 25,000 hours, and save up to £6 per year in high use areas, the payback is quick and prices will tumble as they become more popular.

Basically, the hoary old arguments against efficient light bulbs can be best illustrated by analogy.  Imagine if people were still talking about mobile phones as if they had not evolved since their first emergence in the 1990s?  Heavy, brick like constructions which cost a fortune, took forever to charge, short lifetimes and  limited coverage.  That would be a nonsense wouldn’t it?  Given how far we have come since then!  Well, you can think in the same way about energy efficient light bulbs – we’ve come a long way in the last decade, it’s just some people – and I’m talking about you Daily Mail journos, will simply not recognise this fact.

And we must be doing something right.  The USA have started to implement their own ban; with 100Watt bulbs now off the market and lower wattages to follow. And China, eager to make efficiency savings where they can, will be implementing a 100Watt bulb ban in October 2012, and will have all bulbs over 15Watts banned by 2016.


1 comment

I have been monitoring my new Combisave device over the past month and have now enough data to calculate some initial findings in terms of water, gas and time savings.

Serendipitously, June is a perfect month to monitor gas use for hot water heating, as even with the non-summer we have been having lately, we have not put the heating on at all through the past month, and as I do not cook with gas, the only gas use through the summer months is for hot water use.  Also, luckily, I have monthly readings of summer month gas usage for the last two years (yes, I know, I’m a bit geeky) and so have a high level of certainty about my household’s daily summer gas usage – typically averaging 5.18 kWh per day (as measured over June-Sept 2011).

Also, usefully, I have been on a water meter for years, so  can also easily calculate a daily summertime water usage volume from my previous bills.  Typically, for our two person household it has been around 200 litres a day.

So, how has the Combisave device performed in this past month.  Roll of the drums please…

In the month of June we used a total of 5470 litres of water (this includes 2 short hose pipe uses, after the hose pipe ban was lifted I hasten to add), that works out at around 90 litres per person per day.  Typically, in years past, we have used an average of 100 litres per person per day in the summer months.  So that is a 10% potential saving.  The only other variable in this is the fact that, in years gone past, we might have used the hose pipe more for watering the garden, as the summers have been a little better and drier in recent years!  So it is not totally conclusive.

Turning to the gas saving, which can be more conclusive, I have seen an average daily usage of gas of 4.77 kWh per day in June.  So, we can say that there is probably a small gas saving through the use of the Combisave device of 0.41 kWh per day.

In terms of a time saving, well, it hasn’t saved me any time at all in the mornings whilst waiting for the shower to warm up (if I’m first in), it’s still just over a minute’s wait unfortunately.

To put some monetary savings to these figures:

Water:  If we are, on average, saving 20 litres of water per day,  then total yearly savings could be around 7300 litres.  Now, the average metered price for water in the UK is about 0.25 pence per litre.  So we can calculate that my yearly savings on my water bill could be around the £18 mark.

Gas: If I am saving 0.41 kWh per day on my gas usage for water heating, that will amount to  about 150 kWh of gas saved per year.  Using an average gas price of 4.5 pence per kWh unit, my yearly saving on my gas bill could be around £6 – 7

That gives me a total combined water and gas saving of approximately £25 per year

So, given a total installed price for the Combisave of approx: £130 (made up of the price of the unit plus the plumber’s installation charge – but this will vary), we are looking at an approximate 5 year payback.  Which is reasonable, as the lifetime on the device is said to be 20 years or more.

I’m happy with this, and am glad I invested in the device.  However, what I am not so comfortable with is the extraordinary claims that Combisave have on their website regarding the potential savings that people can make with their gadget.  I feel people would be quite happy with a 5 year payback (or more than likelyless for a bigger household) and then ongoing, year on year, savings on their gas and water usage (if on a meter), there is really no need to ‘over promise’ to such a significant degree, only to really cheese people off when they do not achieve those savings after installation. That isn’t the way to get ‘word of mouth’ recommendations for your product.

So come on Combisave, your product has merit, please don’t spoil it by extraordinary, and, in my opinion and personal experience, overblown claims of monetary savings that it will simply not deliver. 

Related blog post on the subject: http://paulaowenconsulting.co.uk/2012/05/31/the-trouble-with-combination-boilers-a-new-gadget-to-potentially-save-water-and-energy/


21 comments